
HomeShop18 in numbers
 The television shopping and e-commerce firm has just filed its documents to go public in the US. Click here for more on the issue and its basic financial growth numbers. Here we try and bring the highlights of its operations:
Milestones
The firm claims a combined reach of over 250 million consumers, coming through its integrated television, internet and mobile device channels. It says 8.9 million consumers have placed orders with it since its launch.
In October 2009, within 18 months of launch as a television shopping channel, the firm served over 1 million cumulative consumers, with over 1.3 million orders shipped.
The firm launched its e-com operations in January 2011 and by September 2011, it served over 3 million cumulative consumers, with over 5 million orders shipped through both channels.
In September 2012, it hit the milestone of having served over 5 million cumulative consumers, with over 9.9 million orders shipped.
In August 2013, it recorded more than 10 million unique visitors to the website.
By September 2013, its television channel reached more than 66.5 million households across India.
By October 2013, it served over 8.3 million cumulative consumers, with over 17.3 million orders shipped.
It recorded 290,000 downloads of its iOS and Android apps as of December 2013 and its delivery footprint included more than 3,000 towns and over 18.9 million orders were placed on its platform.
Other key operating metrics
The television business has higher average order value per transaction compared with e-commerce unit. In the first half of last financial year the e-commerce stream saw a leg-up in average order value which shot up to Rs 1,501 up 50 per cent over the year-ago period and 26 per cent over the average for the full year ended March 31, 2013. Notably, this was much higher when the e-commerce business was started (around Rs 2,000) and the firm is still some way to match up to it.
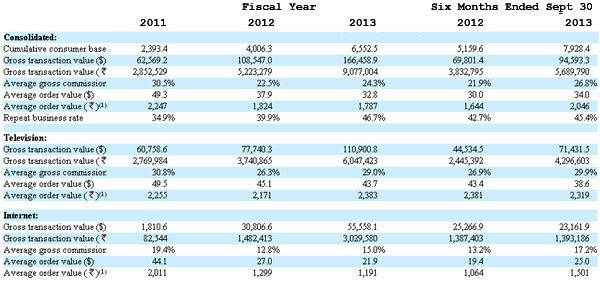
(Note: All figures in the table in thousands, except averages)
From a category standpoint, lifestyle products, which includes apparel, jewellery, health & beauty, office stationery and gifts & flowers, seems to be doing better. As per the data for the first half of FY14, the company derived around 34 per cent of its sales from the lifestyle category against 30 per cent for FY13. Digital products, including mobile phones, cameras, computers and electronics categories, continued to be the top grosser with 41 per cent of sales during April-September 2013 but this declined from 44 per cent in FY13.
Home products, including home & kitchen, appliances, toys and baby care product categories, brought in around a quarter of the total sales. The books category, which contributed 3 per cent of overall sales in FY13, was down to a minuscule 1 per cent for H1 of FY14.
(Edited by Joby Puthuparampil Johnson)
TRENDING STORIES
Next Article